
Climate Risk Dashboard
Climate risk portfolio level view with drill-down capability to the individual asset level
Decision-ready insights for physical climate risk
The Climate Risk Dashboard helps lenders and asset owners understand, quantify and manage physical climate risk across their portfolios. Built to support both regulatory requirements under AASB S2 and real-world risk decisioning, the dashboard translates complex climate science into intuitive, actionable insights for risk, credit and strategy teams.
Delivered natively in Microsoft Power BI, the Climate Risk Dashboard combines fine-grained geospatial intelligence with forward-looking climate scenario analysis. Users can assess physical climate risk at both portfolio and individual asset level, explore multiple hazards and scenarios, and understand how risk evolves over time out to 2100.
What it enables
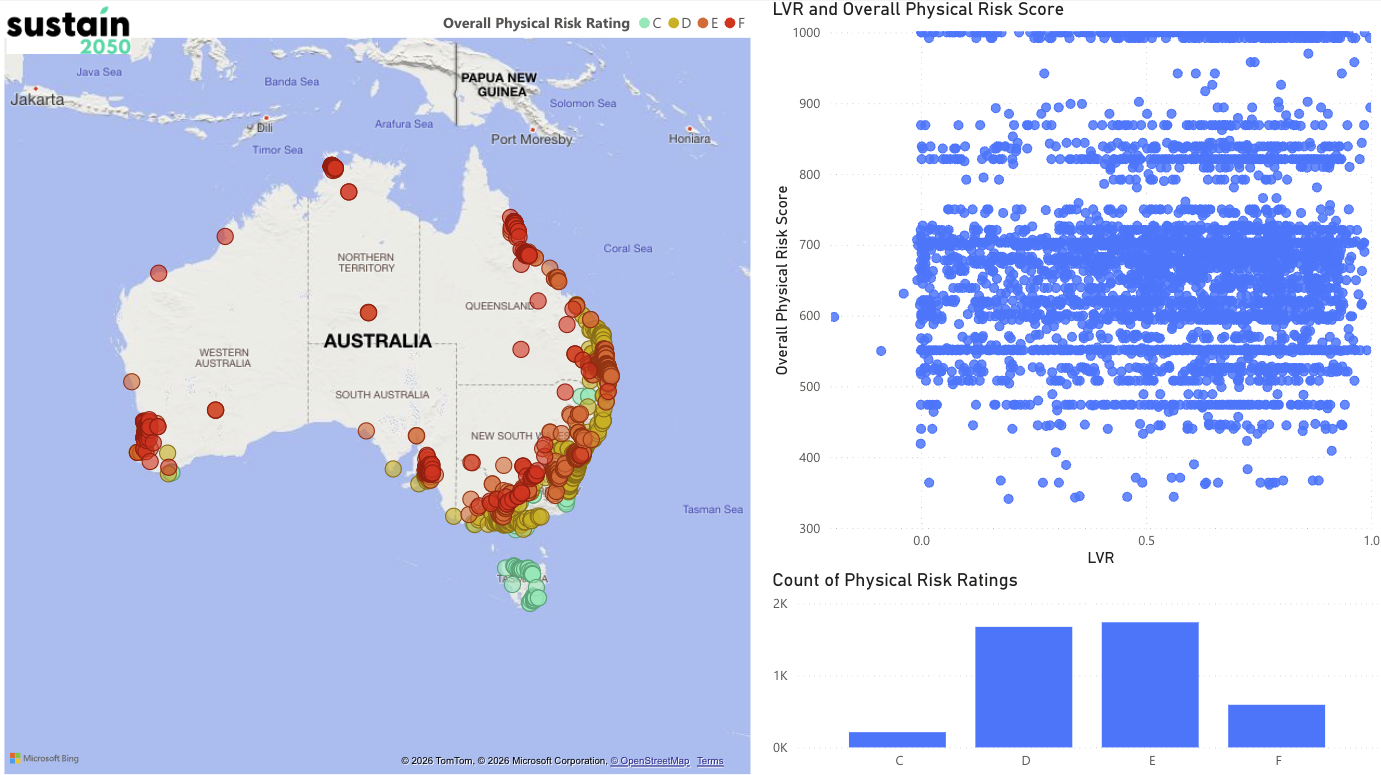
Portfolio risk visibility: identify concentrations of physical climate risk across geographies, sectors and asset types
Asset-level prioritisation: pinpoint high-risk properties to support credit decisions, customer engagement and adaptation planning
Scenario analysis: assess impacts under Paris-aligned and higher-warming pathways across short-, medium- and long-term horizons
Decision support: move from abstract climate metrics to insights that support underwriting, portfolio management and strategy
Key features
Multi-hazard coverage: flooding, extreme rainfall, heat stress, bushfire, extreme wind and coastal inundation
Fine-grain resolution: metre-level geospatial accuracy to capture local topography and exposure
Integrated risk view: climate hazard data combined with loan metrics and portfolio attributes
User-friendly design: intuitive visualisations built for non-technical users
Secure delivery: deployed on pre-approved enterprise technology (Power BI)
How it works
The Climate Risk Dashboard is underpinned by a robust analytics pipeline:
Geospatial enablement to accurately map assets and their physical characteristics
Climate risk modelling driven by climate science, AI and high-performance computing
Damage functions translating physical hazards into expected financial impact
Visualisation that turns complex analysis into decision-ready insights
The result is a single, integrated view of physical climate risk—designed to support compliance, improve risk management, and enable better conversations with customers.
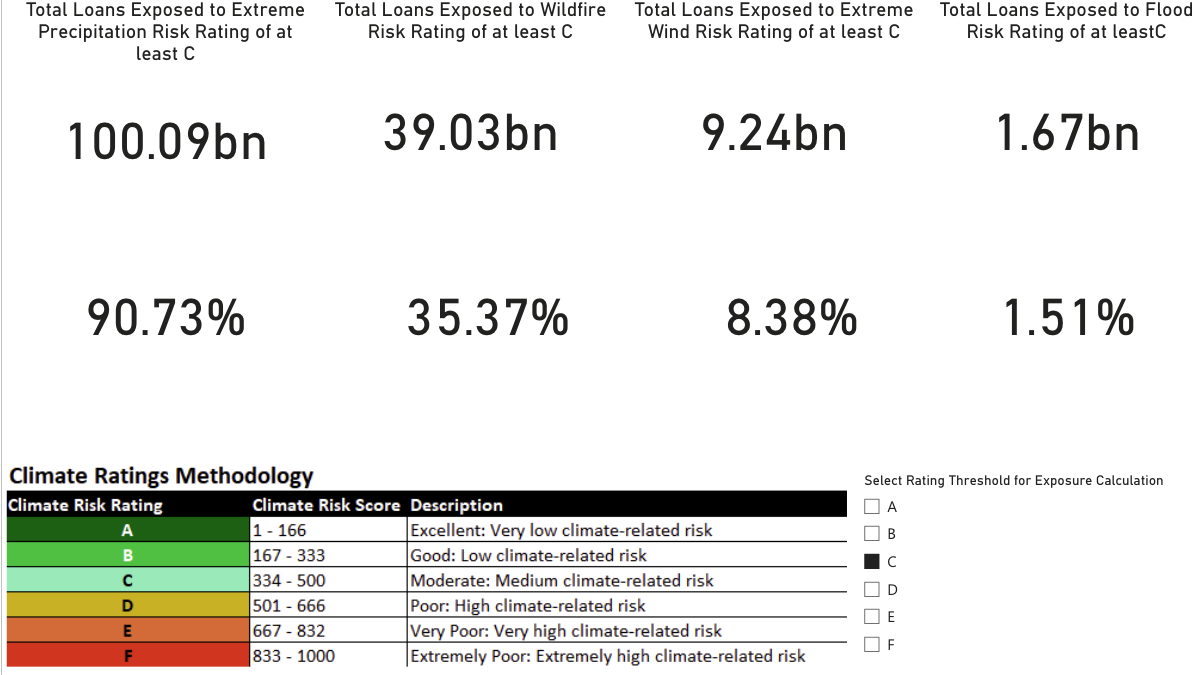
Aggregated loan exposure overview broken down by hazard type and climate risk threshold level.